

Analysis of the traffic between networked devices has always been of interest since devices could even communicate with one another.
As the complexity of networks grew, the more useful dedicated traffic analysis tools became. Major advancements have been made over the years with tools like Snort or Wireshark, but these tools are only useful when accurate information is provided to them. By only sending a subset of the information being passed across a network to monitoring tools, analysts will be provided with an incomplete picture of the state of their network.
This is a problem on nearly all the backplane networks to which most PLCs are attached. Oftentimes, the Ethernet traffic traversing the network can be captured and analyzed, but any non-standard or proprietary communication is often missed. This is the problem that we set out to address with Badgerboard, a new proof-of-concept tool designed to expose previously inaccessible backplane traffic and allow OT network operators to have a better understanding of the current state of their network.
Current state of visibility
Gaining visibility into the goings-on of a backplane network is not a new problem, nor is it impossible. It just requires some extra work to get beyond the easy-to-access information if a fuller picture of that network is desired.
Span ports
Many PLCs and their associated networking modules already contain an Ethernet port that can be configured as a span port for analysis of traffic on the backplane. The issue encountered here is that these span ports only provide visibility into the Ethernet traffic, which is not necessarily all of the device-to-device traffic occurring on the backplane.
WeaselBoard
In 2013, the Sandia National Laboratory released a technical report detailing their work on a project referred to as “WeaselBoard.” This was a physical module that would attach to a supported backplane to provide visibility into traffic that was otherwise not available for analysis. It boasted zero-day protection for PLCs mounted on the Allen Bradley ControlLogix 5000 Backplane and the S7-300 Backplane, accomplished by analyzing changes in the underlying system.
Additional information on the WeaselBoard project can be found on the Sandia National Laboratory project site.
Developing Badgerboard
Before diving into the technical details of how Badgerboard came to be it seems pertinent to set the stage for both what this project is, and more importantly, what it is not.
Badgerboard was intended as a proof-of-concept research project to show that expanding the visibility of the backplane is feasible. Due to the nature of our day-to-day work, Badgerboard was never intended to be, and is not currently considered, a fully engineered solution, a generic solution, or even actively supported. We hope that this project will serve as a call to arms for customers to demand more advanced and more complete monitoring solutions from their vendors.
Modicon M580 and the X80 backplane
The Modicon M580 is the latest in Schneider Electric’s Modicon line of programmable automation controllers. The device contains a Wurldtech Achilles Level 2 certification and global policy controls to enforce various security configurations quickly. Communication with the device is possible over FTP, TFTP, HTTP, SNMP, EtherNet/IP, Modbus and a management protocol referred to as “UMAS.”
The X80 Backplane is the piece of hardware on which the Modicon M580 gets mounted, allowing for high-speed communication with other compatible modules.
We chose this setup for a couple of reasons: We were familiar with the controller and the associated EcoStruxure environment due to some prior work and this equipment provided a good baseline for top-end equipment at the time. It is important to note that the underlying issue addressed with Badgerboard is not unique to the M580 or Schneider Electric. This is an industry-wide issue that we are simply demonstrating on the chosen equipment due to availability and familiarity.
X80 backplane hardware analysis
The ports exposed by the backplane for modules are set up in pairs of receptacles, one for Ethernet communications and one for XBus communications.
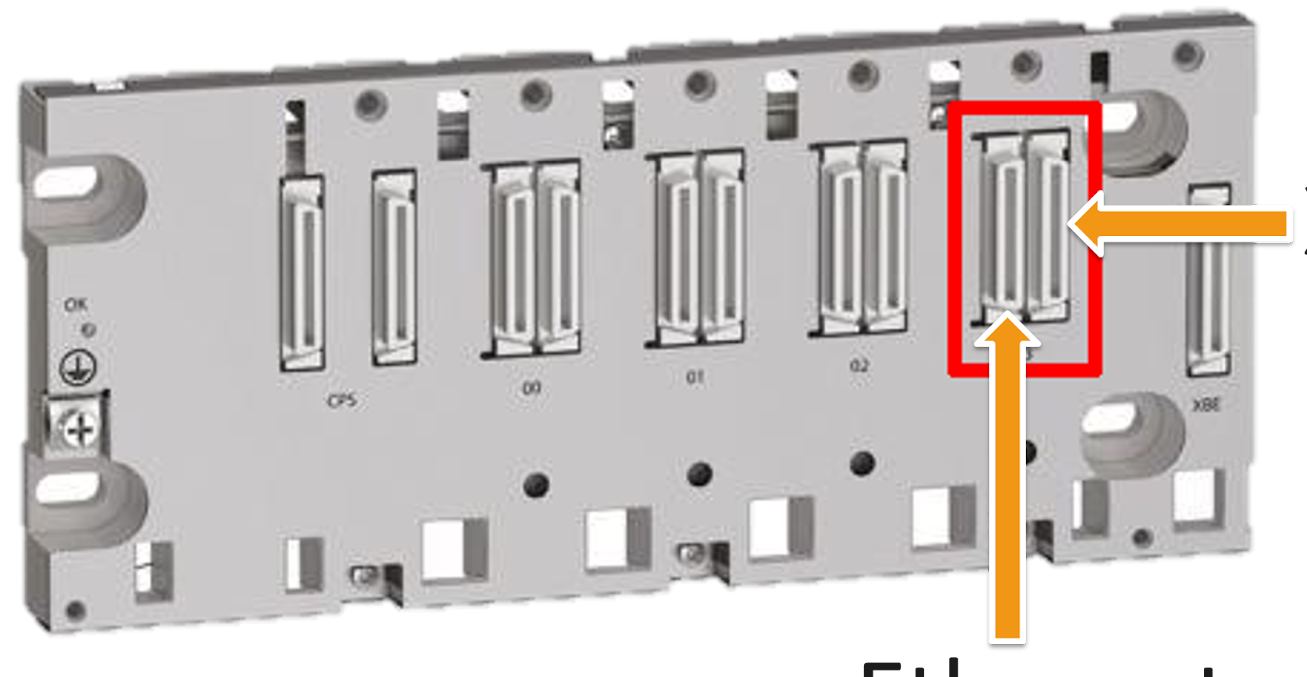
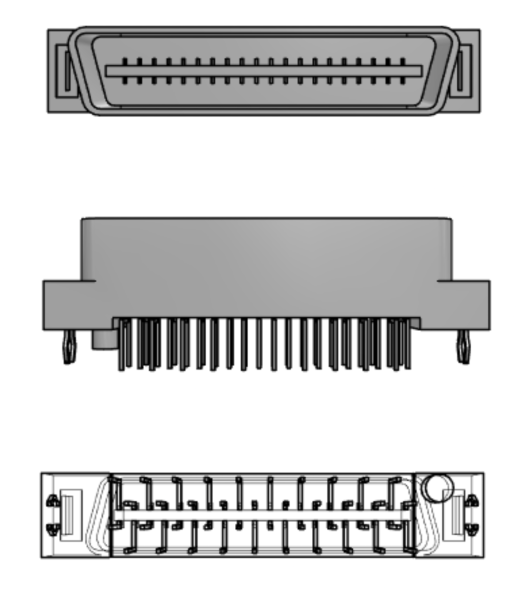
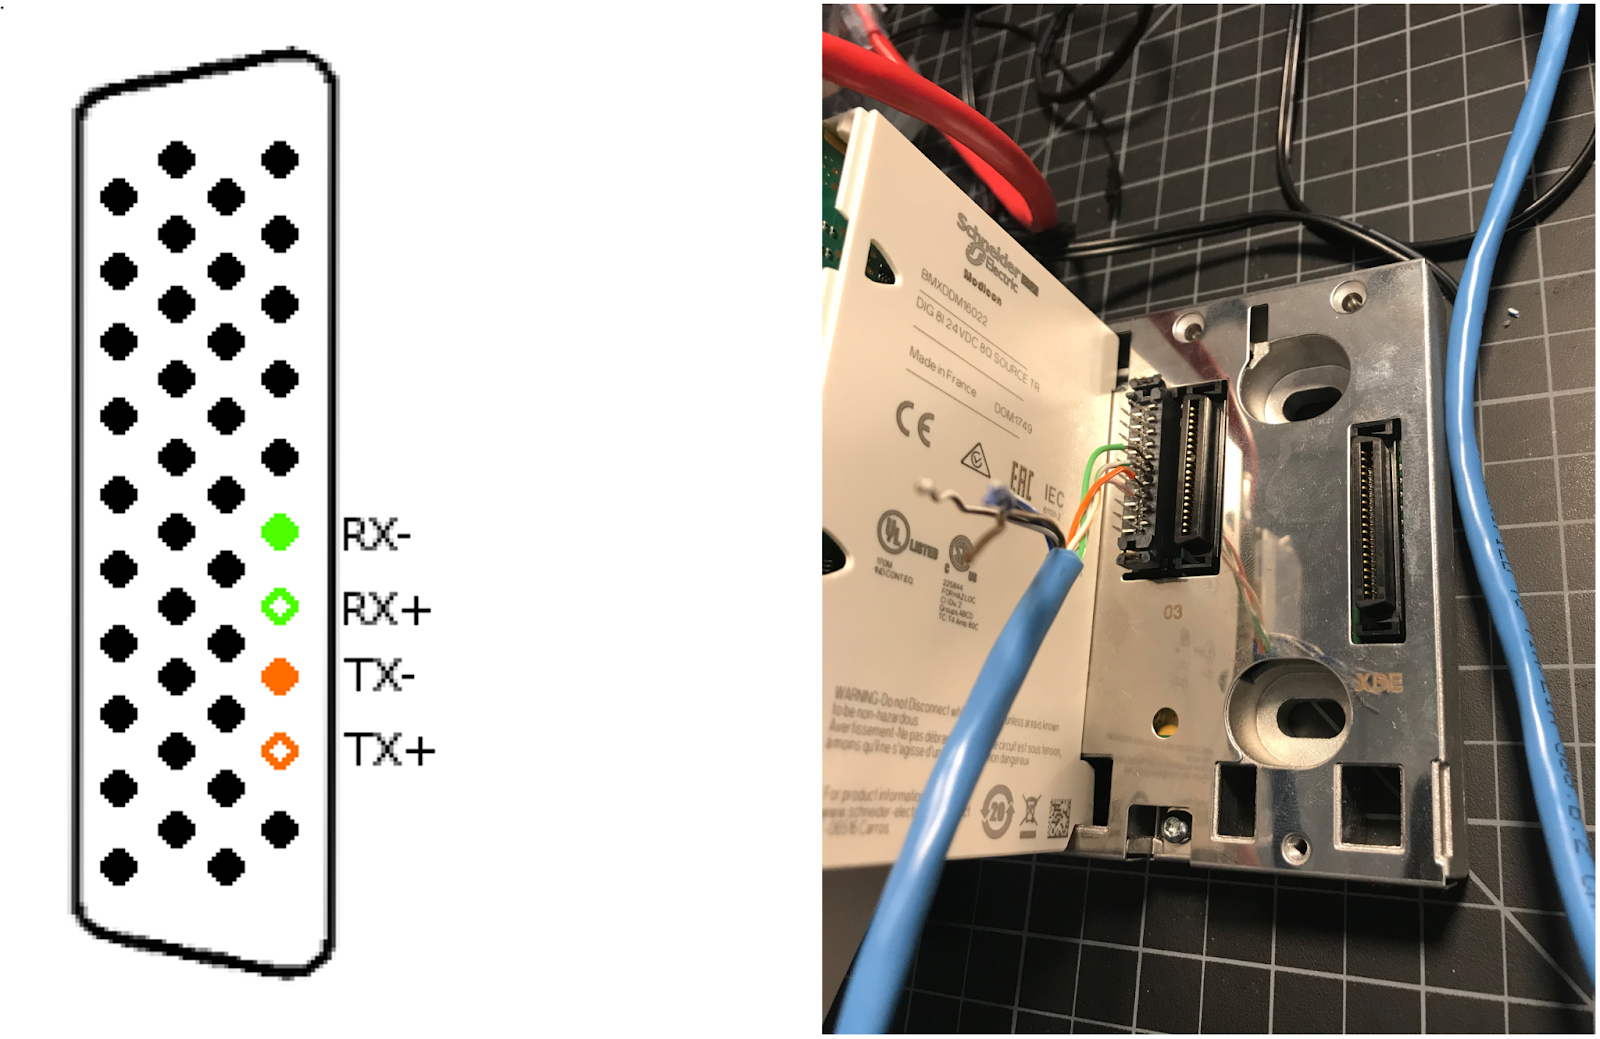
When a module is placed onto the backplane, it can connect to either one or both of the available receptacles. In the case of the CPU module, both are connected. This plug on the backplane communications board matches nicely with the Molex 15922040 Plug, shown below.
Ethernet
Since the CPU module has an ethernet port, it can be used to determine the pins used for Ethernet.
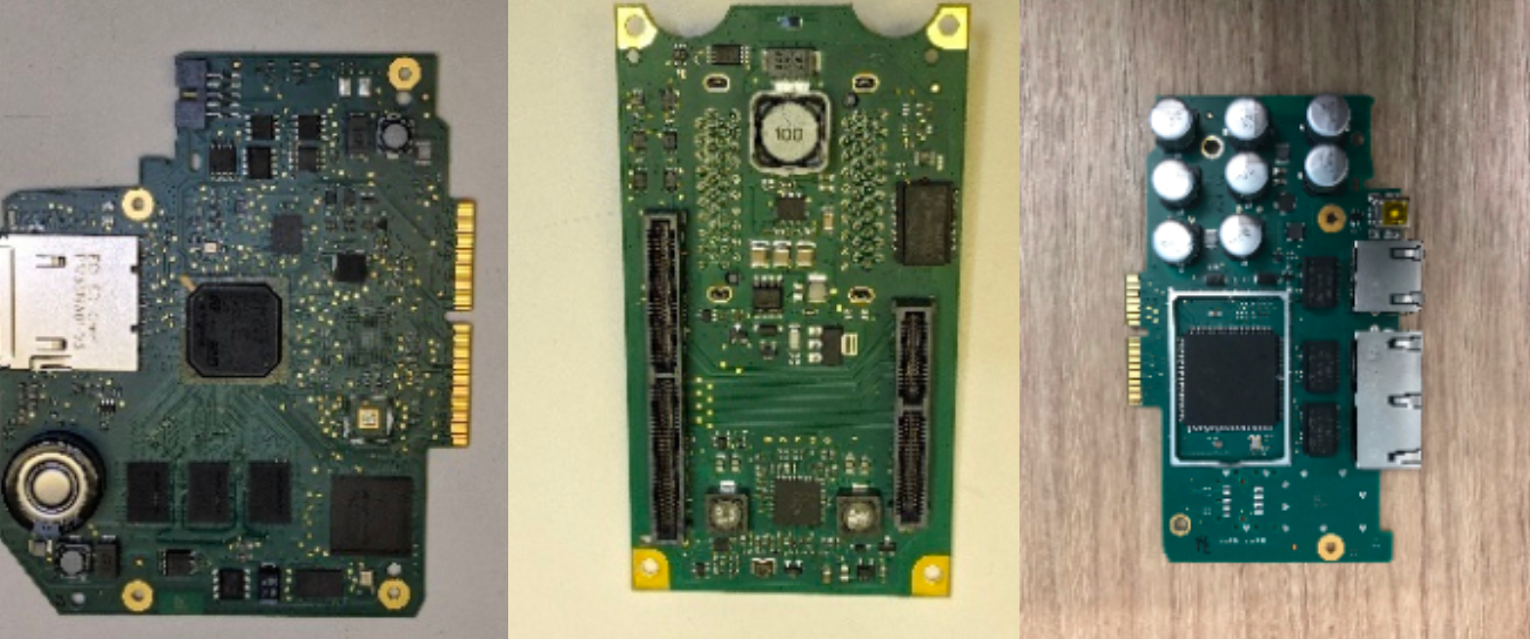
CPU Module Analysis
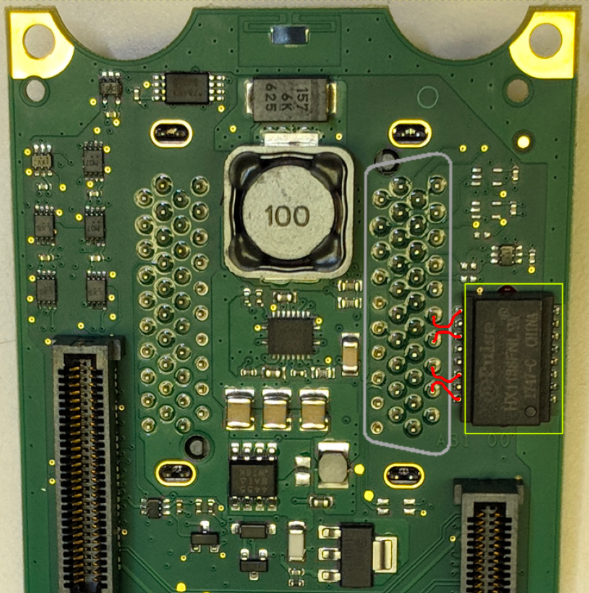
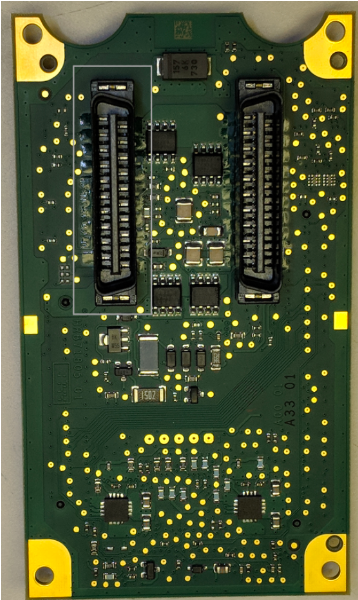
The CPU module is made up of three parts: the external communications board (left), the processing board (right), and a backplane communications board (center). The external communications board and the processing board connect to the backplane communications board, which then connects directly to the backplane.
On the external communications board, there are three RJ-45 ports (shown in red) that each connect to a signal transformer (shown in yellow) followed by the switch chip (shown in purple), and finally, out to the backplane communications board through the wafer connector (shown in green).
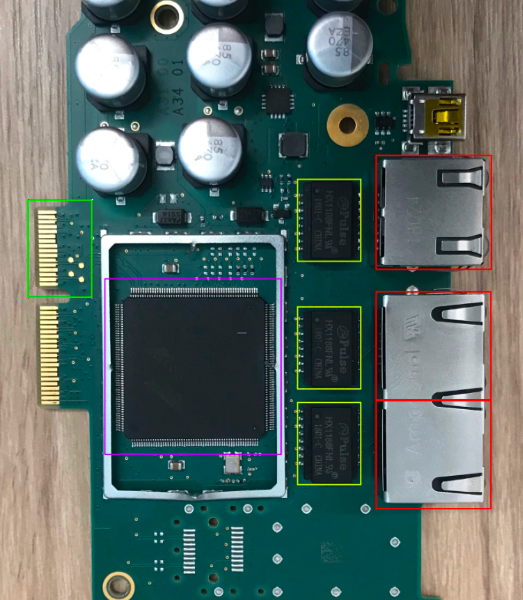
When connected to the backplane communications board, ethernet traffic is connected to another signal transformer (shown in yellow) by traces that are not visible on the board. The signal transformer then connects to four pins (shown with red traces) on the bottom side of the plug (outlined in gray)
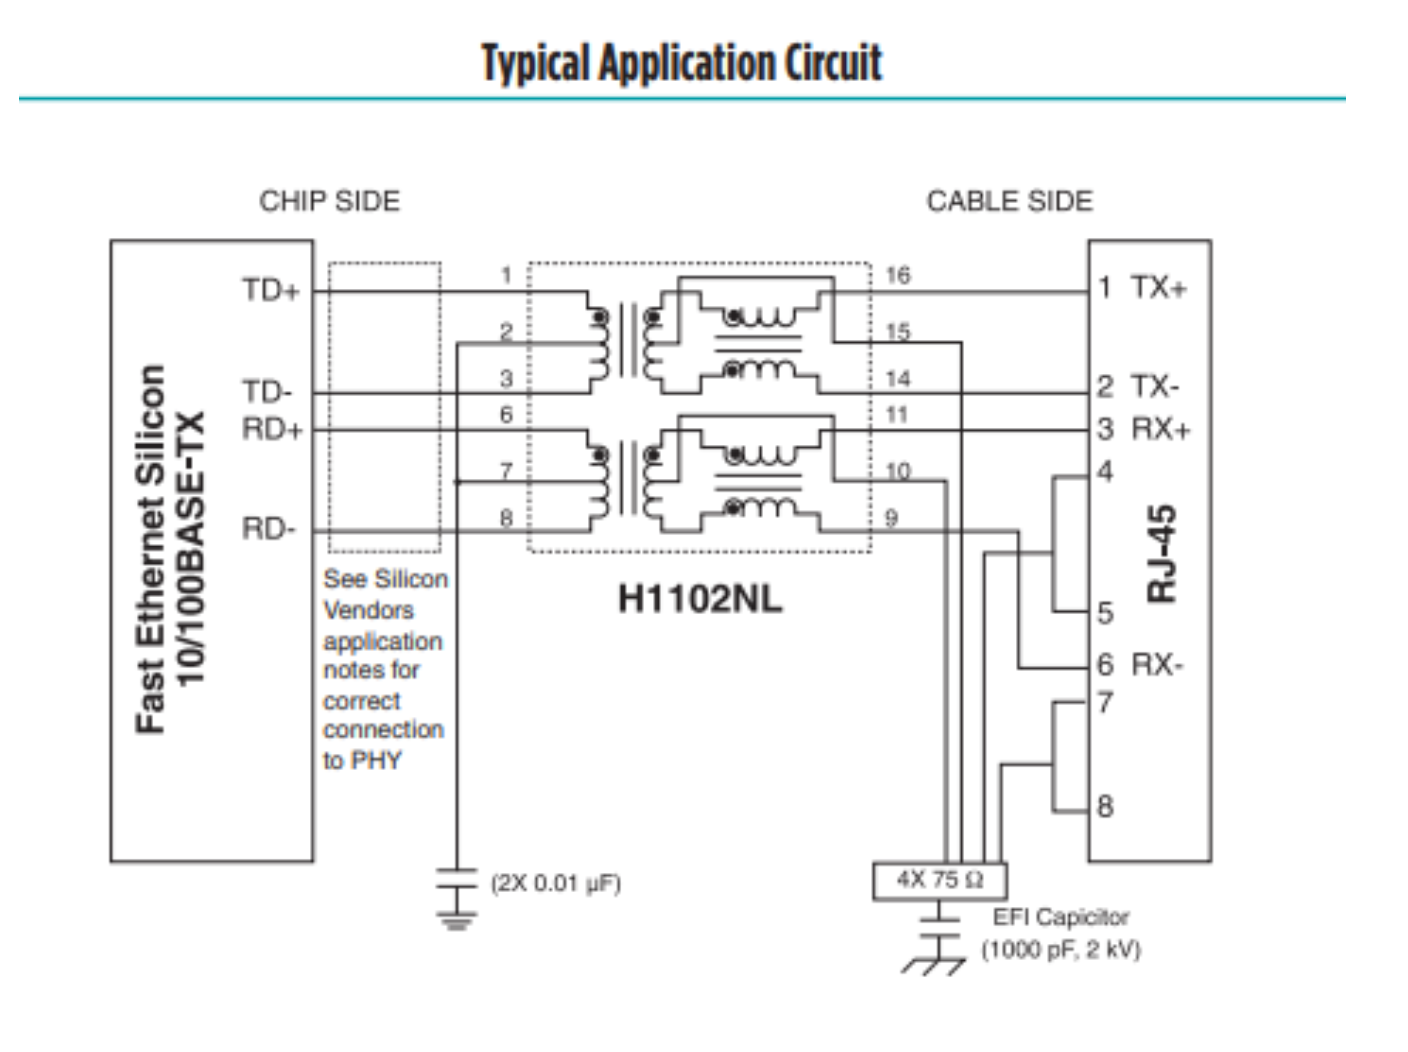
Signal transformer analysis
We determined the pinout by looking at the datasheet for the signal transformer. Since the transformer only supports 100Base-Tx communications, only four wires are necessary. Looking at the example application circuit, we see that the pins are mapped out as follows:
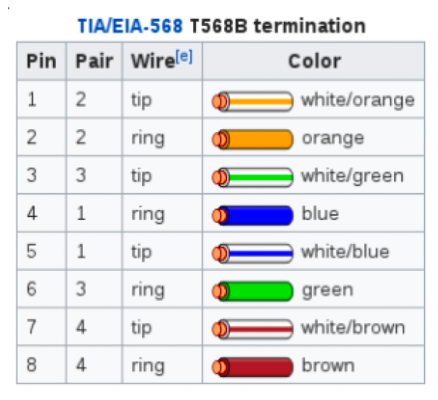
Determination of which wires to use can be found in the TIA/EIA-568 T568B termination pinout.
Pinout
Using this information, we can connect a standard Cat5e ethernet cable to the pins marked below and inspect traffic just like we were on any other Ethernet network.
Traffic analysis
Getting on the backplane network
Using the pinout discussed in the Hardware Analysis section above, it is possible to make a cable that connects to the backplane with the following steps:
- Get an Ethernet cable wired to TIA/EIA-568 T568B.
- Cut off one end and strip the casing to expose the twisted pairs.
- Strip the casing for the green, white-green, orange, and white-orange wires.
- Solder the wires as shown above.
- Make sure the backplane is powered off.
- Plug in the cable.
- Power on the backplane.
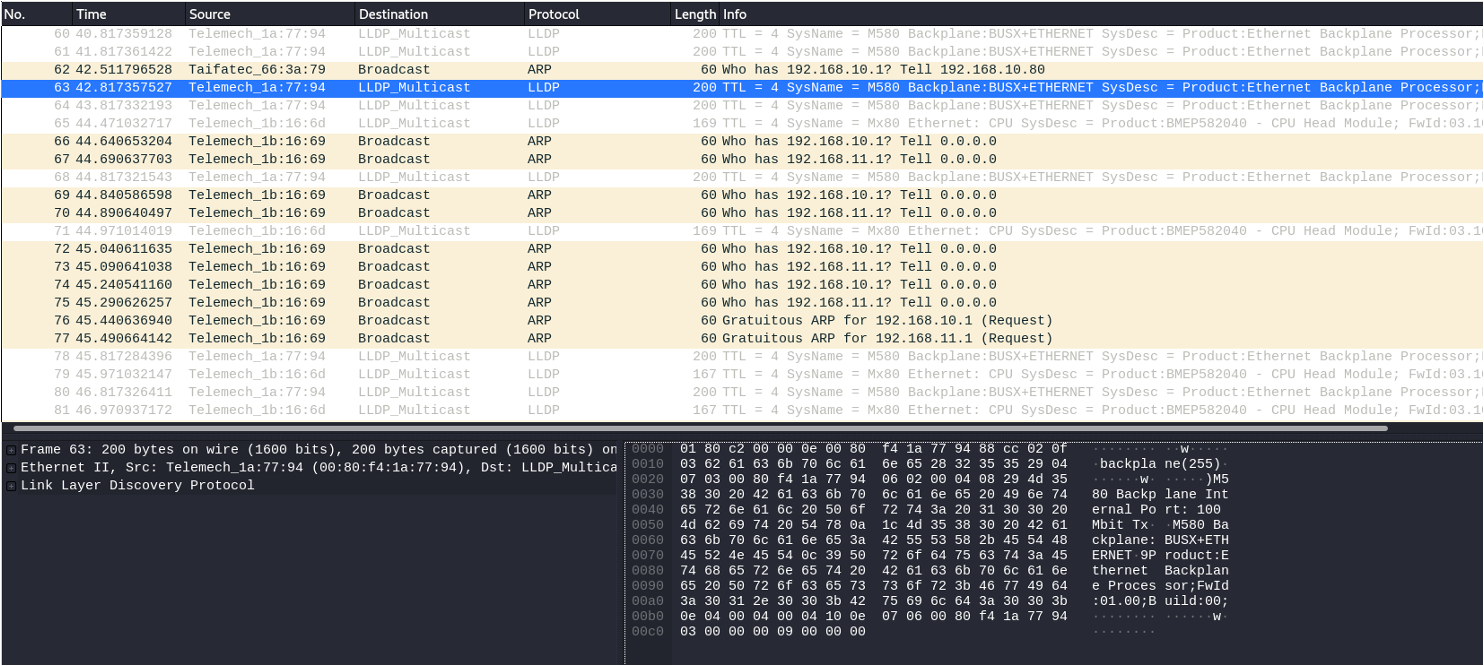
Once physically connected, give yourself an IP in the 192.168.10.2-253 range. When successful, Wireshark should show (among other things) a ton of ARP traffic.
ifconfig eth0 0.0.0.0 upvconfig add eth0 1ifconfig eth0.1 192.168.10.201/16 upIntercepting traffic
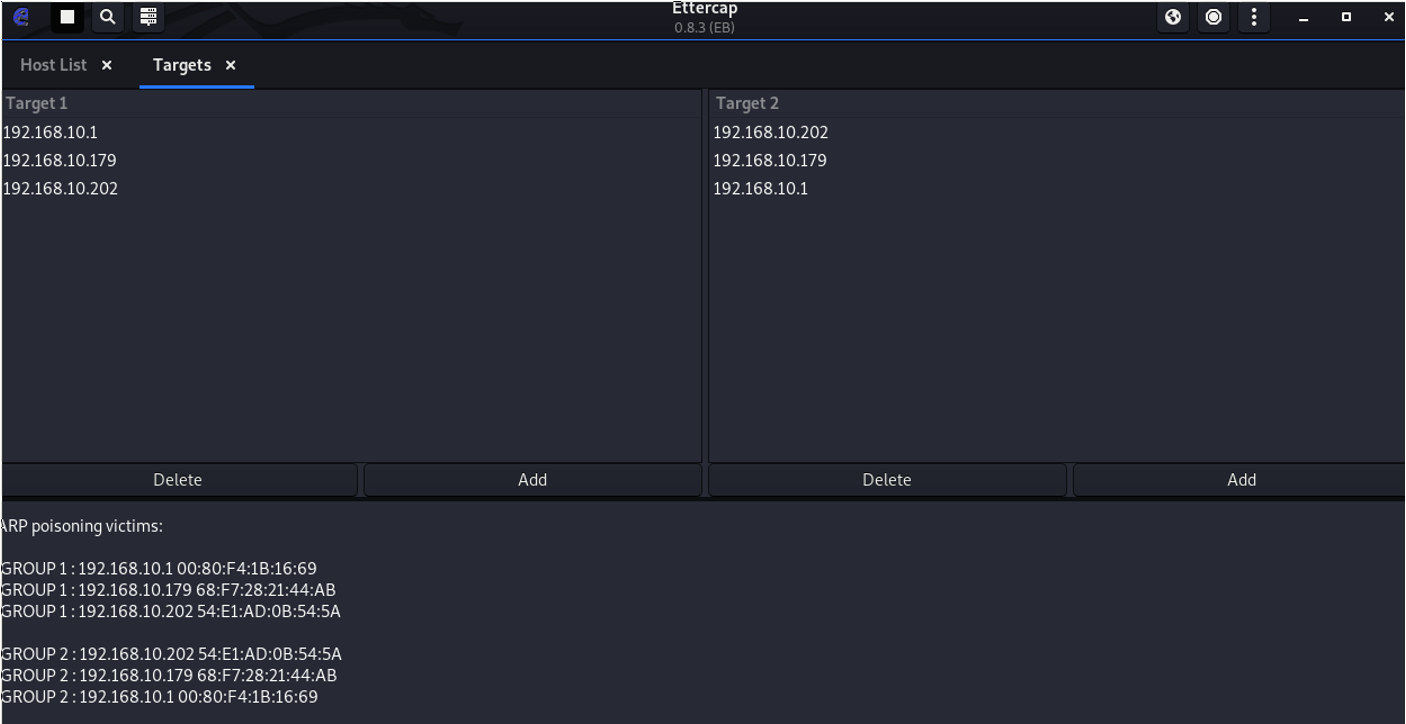
Once on the network, it is possible to see Layer 2 traffic and anything destined for or originating from you. Since there isn’t a span port (that we know about), an arp poisoning attack can be used to intercept traffic.
While connected to the backplane, do the following:
- Start ettercap
- Go to Sniff > Unified Sniffing and choose eth0.1 (or whatever interface you’ve configured)
- Go to Hosts > Scan for hosts
- This will populate a list of available targets to poison
- Go to Hosts > Host List
- Pick the desired targets and add them to BOTH Target1 and Target2
- Go to Mitm > Arp Poisoning
- Watch in Wireshark
XBus
Using one of these same plugs, it is possible to wire a method for extracting XBus communication via the backplane. Once on the bus, it is possible to see all the traffic being sent on that bus. This can be done with a logic analyzer, and once the traffic is intercepted, it is time to move on to analysis.
The Bus
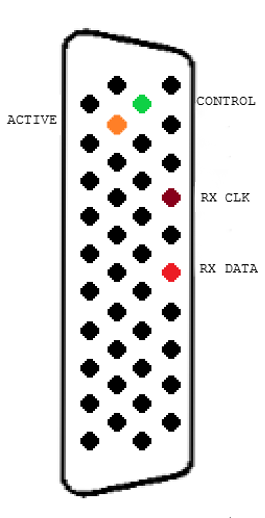
Basic communication on the XBus requires the use of four important lines. They are broken out as follows:
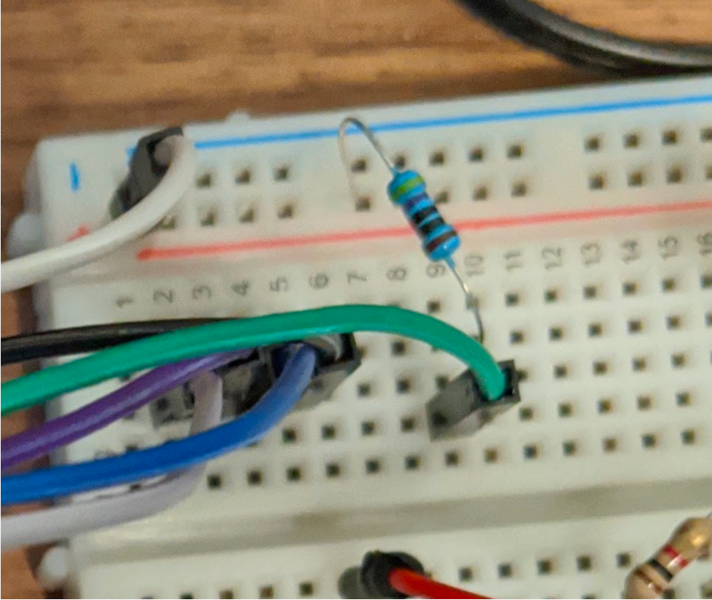
Activation pin
Once the pinout has been identified, it is fairly simple to start capturing traffic. The ACTIVE pin must be pulled high, ideally through a low-resistance resistor to not degrade the signal. In the image below, we are using a 470Ω pullup.
Control pin
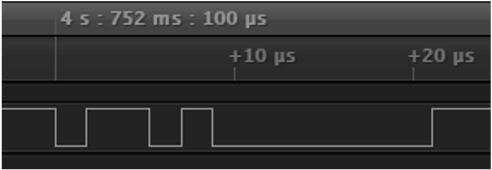
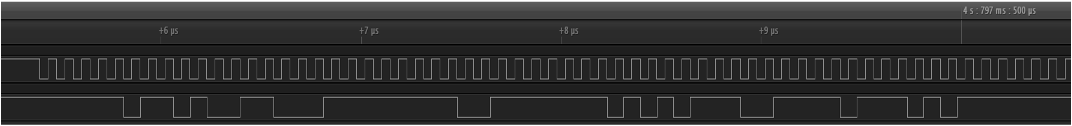
The CONTROL traffic is always visible — even if the port is not considered active to the backplane — which can be an easy way to orient yourself to the provided pinout. This signal is significantly slower than the bus speed: These are presumably clocked at around 500 kHz, but more analysis needs to be done on these messages to determine their use.
The difficulty here is that these messages are most likely directly related to the physical network protocol and thus, are handled directly by the FPGAs that implement XBus. This makes it difficult, if not impossible, to track down any concrete definition of the purpose of these messages.
These control messages seem to be linked to the claiming/releasing of the shared bus and the device address that is claiming/releasing the bus. We specifically tested that some form of the address is sent in this message, but can’t completely test for field size and all possibilities.
Receive clock
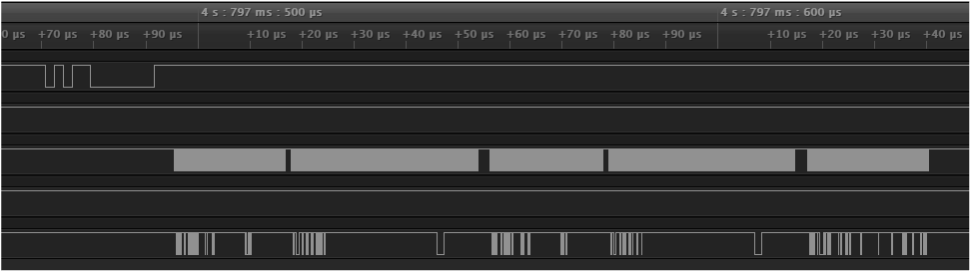
The RX_CLK is how all modules keep track of data being sent on the shared RX_DATA pin. This clock is driven by the currently active device and could change (although we have not seen it, this is always 12 MHz in our testing). This clock is shared with all of the active ports on the backplane.

There are a few important features of this clock that cause some design issues down the road but can also be leveraged for a unique solution. The clock is completely inactive when a module is not talking (seen at the end of the previous image). This inactivity means this clock is not great for clocking a hardware module (since it wouldn’t run when the clock is inactive). The benefit of this is that it shows us hard message separations as the module will drive the clock to deactivate the clock before sending a new message. This can be seen here as the CONTROL line has no new messages sent, while the clock is very obviously deactivated for a time before reactivating and continuing to send data.
Another unique challenge of this clock is the high speed that it operates at, roughly 12 MHz which means dedicated hardware, and no use of slow communication protocols such as UART.
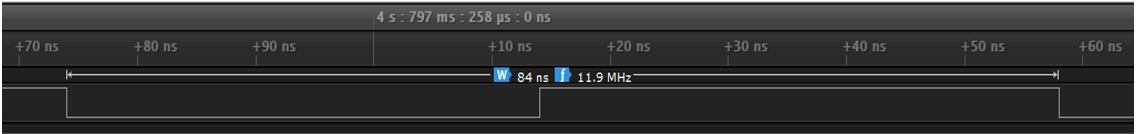
This high-speed clock drove a lot of the design constraints we had in the hardware implementation that will be discussed in later sections.
Receive data
The RX_DATA pin is used by all modules to read data from the active module. This is an active low signal which is unique due to the RX_CLK and CONTROL pins all being active high. The data is read at the rising edge of the RX_CLK. This data seemingly has roughly five clock cycles before data is seen for a valid message which explains the starting value of messages always being 0x04 or 0x05 (five 0 bits)
Programmatically sniffing XBus traffic
Inspecting the XBus with a logic analyzer, while functional, is not a feasible solution for ongoing analysis. To this end, we needed a programmatic solution to do this work for us and present the information in an easy-to-digest format.
Hardware constraints
At this point, there is a pretty restrictive set of constraints in place for a solution:
- Must be as close to “real-time” as possible.
- This means no “slow protocols” such as UART (1-3 MHz in most commercial chips).
- We have to measure at least 12 MHz. If we take a conservative speed to properly sample, we have to run at a speed of at least 48 MHz.
- Must be on the backplane, ideally not between devices and the backplane.
- We can’t rely on the backplane clock due to it turning off regularly.
- We have to get the data into something Snort can detect.
After considering our options, we decided to approach the problem with a hardware solution and chose Artix-7 FPGAs as a reasonable platform to develop on.
Hardware Approach 1: Failure
The initial solution was to ignore UART limitations (which were unknown at the time) and build a hardware solution that shipped data over UART directly from the backplane, one byte at a time. While the extraction of data from the backplane was successful, UART was a massive bottleneck and killed any semblance of real-time data detection into Snort.
Hardware Approach 2: Our Solution
Overview
The hardware design is as follows:
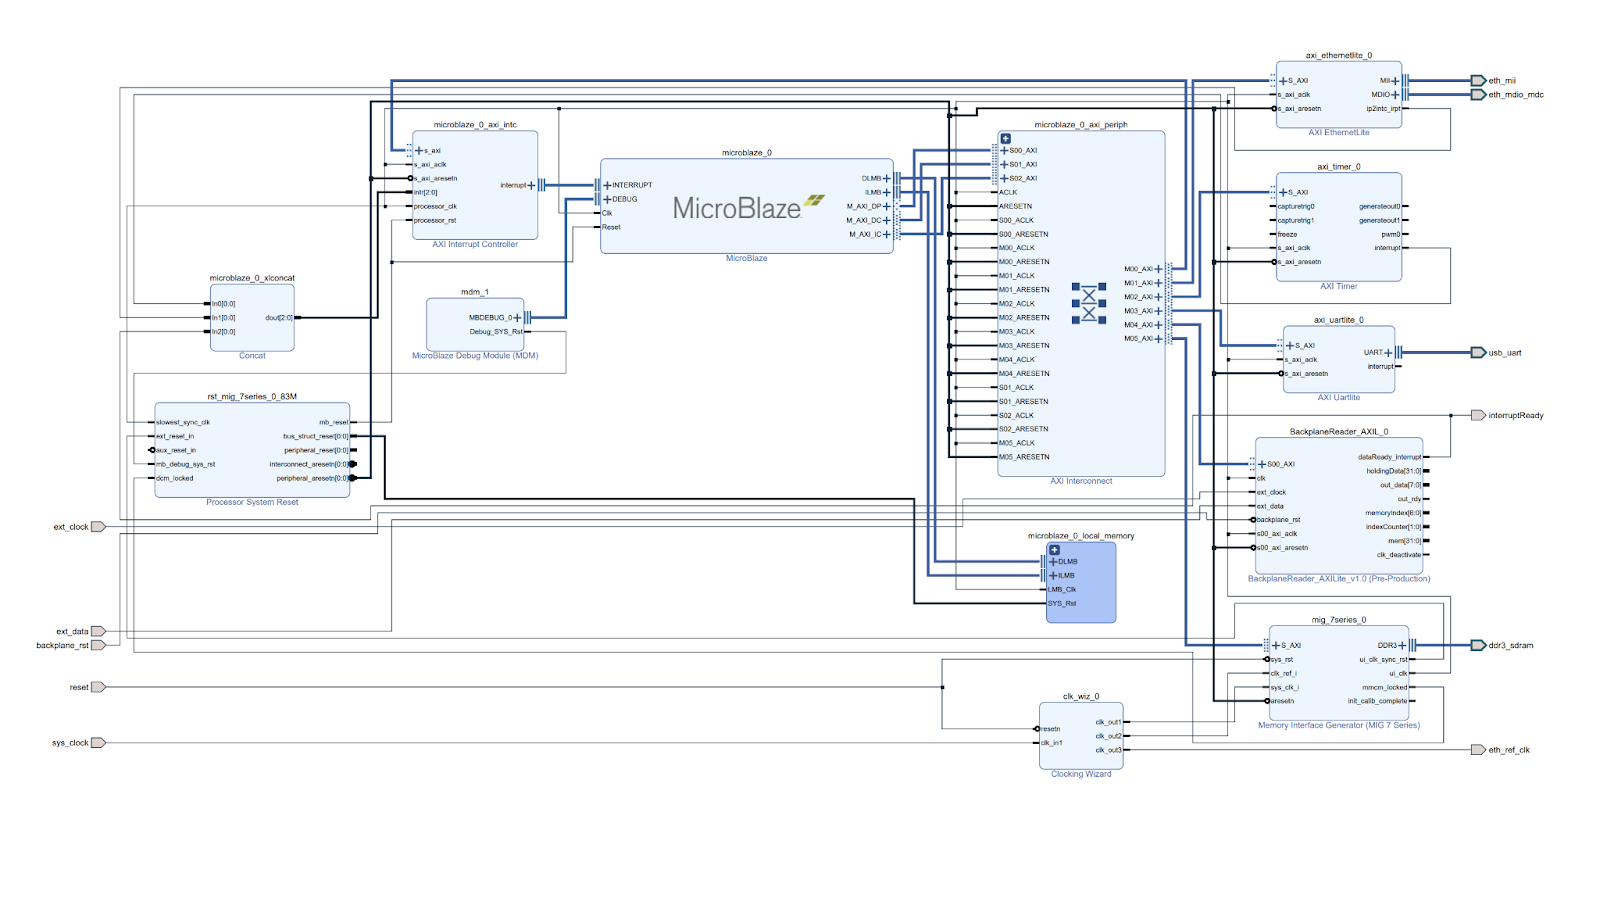
This is a Microblaze processor which is included in Vivado. It is clocked at 83.333 MHz (higher than our required 48 MHz). Our physical inputs are on the left side of the image. sys_clock and reset are provided by the board itself. ext_clock, ext_data and backplane_rst are all inputs. ext_clock is connected to RX_CLK from the backplane, ext_data is connected to RX_DATA, and backplane_rst is connected to a dip switch on the Arty-A7 to purge all of the buffers during operation (this is mostly just for testing and troubleshooting).
This Microblaze processor includes UART, and Ethernet, as well as a simple timer peripheral. This allows us to use the 10/100 Ethernet module as our communication output.
The most important part of this design is to note the BackplaneReader_AXIL and the connection of the dataReady_interrupt back to the Concat block entering the interrupt controller. This interrupt signals the Microblaze processor when data is ready to be read from the backplane and be sent out over the network to the listening process for further processing.
The general flow of data is as follows:
- Bits recorded at the rising edge of RX_CLK, bits are shifted into a single byte.
- Once a byte is captured, a flag is set to signal that the byte is ready for transfer.
- When the flag is set, the byte is shifted into a 4-byte buffer, and a counter is incremented.
- Every time the counter modulo 4 equals 0, the 4-byte buffer is written to the AXIL register of the correct index, and the buffer accepts new bytes.
- This loops until the RX_CLK goes inactive (high) for more than 80 clock cycles (83.333 MHz clock cycles) we trigger the interrupt to the CPU which then sends the data to the network using zero-copy for performance.
Module descriptions
These modules are the building blocks of Verilog. One can look at them as something like functions in normal programming languages. These building blocks will be covered from the smallest (most basic) to the largest (most complex). They will include whether they are building on previous modules or not.
clock_reset
This is a very simple module that runs at the high-speed hardware clock (83.333 MHz for our example) to sample the slower backplane clock (12 MHz). It takes a parameter of a comparison value and this is used to check how many fast clock cycles the backplane clock has been high. This module is instantiated in two forms, a fast form and a slow form. The slow form (80 counts) is to determine when a message is completely done and the backplane clock goes inactive for a “long” time. The fast form (five counts) is used to group fragmented messages. This is purely for performance that was required to get all the messages out of the processor before the next interrupt occurred.
Previous to this grouping of messages (which always seem to be related in our testing, specifically we see this in UMAS messages that get fragmented across multiple XBus messages), the Microblaze processor was operating too slowly to get messages out via UDP before another interrupt occurred, this caused issues with memory leaks (before zero-copy implementation), but also causes us to lose packets, because the UDP messages are all so small (roughly 48 bytes of data) we decided to start combining packets to reduce the overhead of moving the packets to the NIC and sending them. This is a possible performance bottleneck that could be improved.
sample_output
This module builds on the clock_reset modules. Specifically, this module is responsible for sampling bits from the ext_data input, which is RX_DATA from the backplane. It does this sample by shifting inverted bits (because this signal is active low) into a one-byte buffer and incrementing a counter. Once that counter hits eight, we have a full byte and we set a flag showing that the byte is ready to be sampled. We have to do this buffering because we are crossing a clock domain at this point, from the backplane (12 MHz) to the FPGA/CPU’s clock (83.333 MHz).
This module is also responsible for tracking the output of the fast and slow clock_reset modules. When these clock deactivations are set, two different things happen. When the fast clock_reset is set, the byte buffer counter is reset, which means we are starting a new byte. The issue this resolves is when you have multiple messages before a slow clock_reset and you have bits that don’t belong to a real byte. The RX_CLK is active beyond the end of the last bit of real data, for roughly five clock cycles (it changes) which causes garbage data to be collected. This fast reset will clear our bit counter and we will overwrite the garbage data with valid data for the next message. The slow clock_reset is when a backplane module is done talking. This rests the counter, deactivates all logic (so we aren’t recording garbage data), purges the one-byte buffer and resets the clock rising-edge detector. Once the slow clock_reset signal is unset, it resumes normal operation of detecting bits on the rising edge, and recording them.
Between this module and clock_reset this performs the physical, bit-by-bit processing of the backplane data. and is somewhat simple and easy to understand, all the modules above this are used for buffer, clock domain changes, processor interfacing, and ease-of-use.
BackplaneReader_AXILite_v1_0_S00_AXI
This module is the main interface for the processor backplane sampling. It contains all of the glue logic for the AXI-Lite protocol (courtesy of Xilinx/Vivado). The glue code has been modified to completely disable write functionality to any of the memory-mapped registers (read-only memory space in the processor). This wasn’t entirely necessary for optimization, but there is no reason to be able to write to these registers.
This module builds on sample_output and when a single byte has been collected from the backplane it collects that byte and shifts it into a 4-byte buffer and increments a counter. Once that counter, modulo 4 is zero, stores the data in the 4-byte buffer into the register associated with the current offset counter, then the offset counter is incremented. This is used to populate the memory-mapped registers with data from the backplane in real time. The offset counter is reset at the end of every message and it writes to the same buffers every XBus message (starting from offset 0) each register contains four bytes of data from the backplane, except the last register (register 64) which contains the number of registers currently populated (which means to get the length of data, we multiply by four). This module is responsible for populating all of the memory-mapped information to the processor itself so we can use this peripheral from software later.
This module is also responsible for flickering the dataReady_interrupt to the processor so it can begin processing the XBus message. It has to keep track of the length of this flicker and that the flicker (1 clock cycle only) has already occurred for a specific message. This is a solution to a processor configuration (interrupt on level instead of rising edge) you can change this processor configuration which would fix the issue as well, but this is the safest option to reduce error. If you don’t have this fix in place, the processor will get caught in an interrupt loop and not send any data at all since it is constantly interrupting itself.
BackplaneReader_AXILite_v1_0
This module is simply a wrapper for all the internal modules and directly wraps BackplaneReader_AXILite_v1_0_S00_AXI, it passes signals directly through and serves no other purpose.
Microblaze System
Once we have developed our IP (that is how it is packaged in Vivado), we can begin to integrate it into a Microblaze processor system. This integration occurs with the AXILite protocol. What this gives us is a peripheral that is directly memory-mapped into the processor’s memory space and can be accessed by directly reading memory. This interface gives us the same ease of use as you would expect with a RAM module or an ethernet module in any processor or SOC you normally work with.
Microblaze Configuration
The normal configuration for Microblaze processors was used, the most basic of walkthroughs can be found here. This means we need our clock wizard, which generates 166 MHz, 200 MHz, (both of these are for the memory controller), and 25 MHz (Ethernet reference clock). We also need a memory controller that is responsible for interfacing with the Arty-A7’s onboard RAM. Then we add the Microblaze processor which automatically includes the interrupt controller, the processor system reset, the debug module (if requested), local memory for the processor, and an AXI controller (for all of our peripherals). We then need to add the ethernet module, the UART module, an AXI timer, and our backplane reader peripheral.
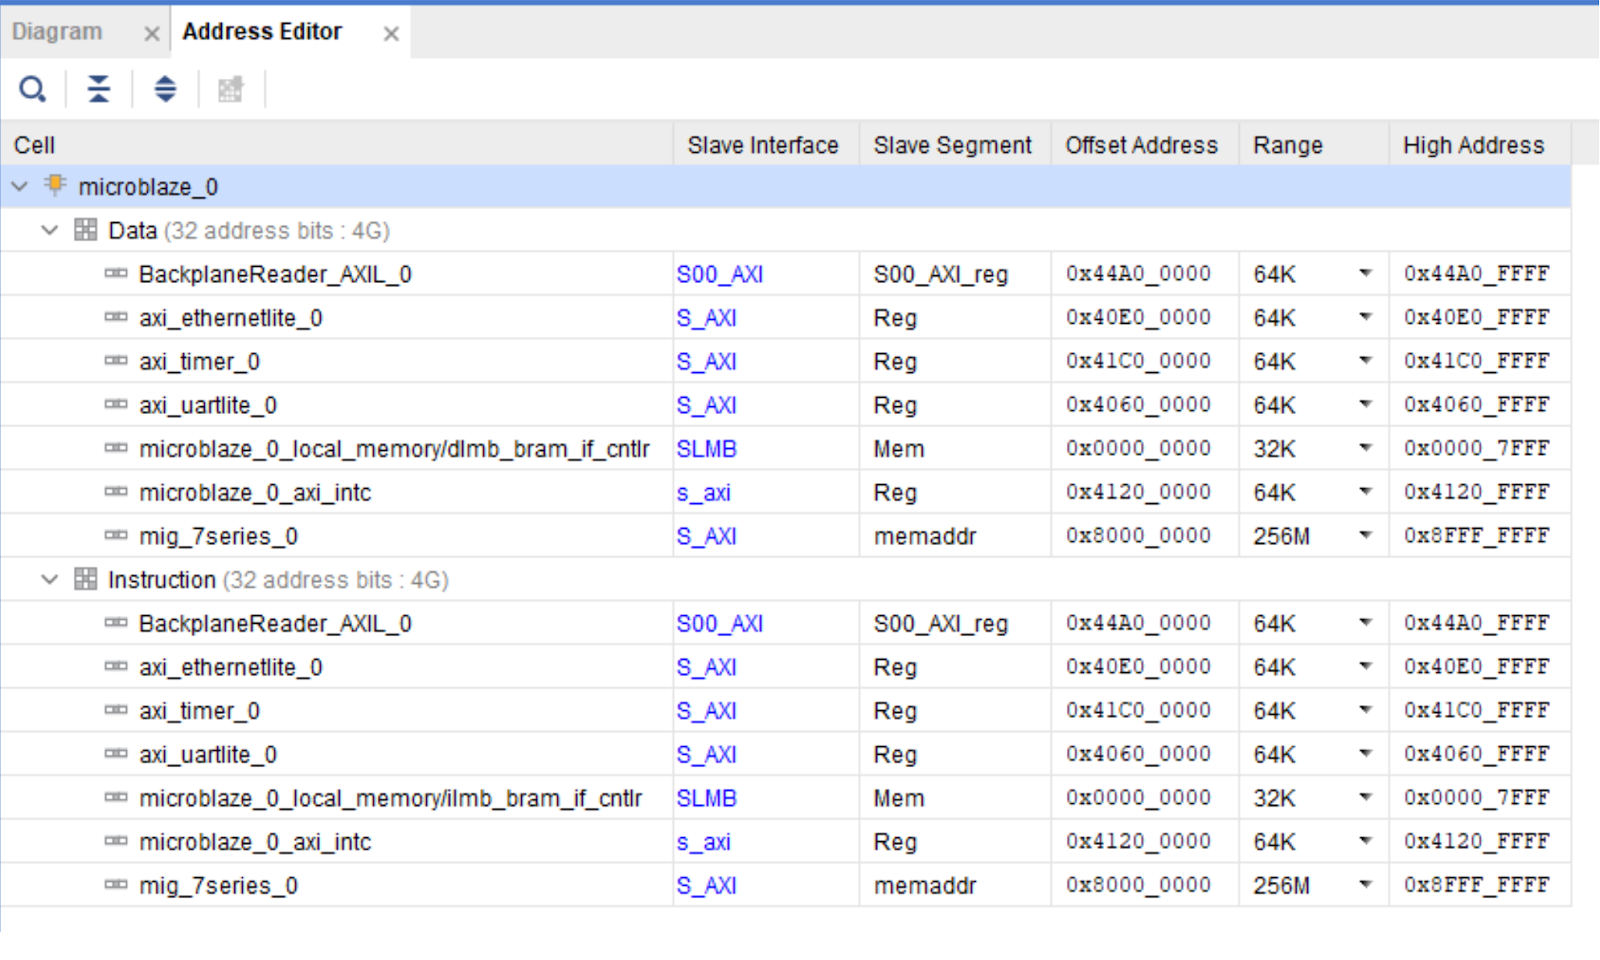
Once we have added all of our peripherals there are two extremely important steps. We need to connect our BackplaneReader_AXIL peripheral and connect the dataReady_interrupt to our processor interrupt controller. This is done through a Concat block which is how we can add interrupts together for this processor. It is also very important to check the memory map of the processor that was added, as well as the configured Data-cache and Instruction-cache addresses. If you do not check these values, they will cause you endless headaches as you try to boot your processor and nothing works, and no errors are given. When adding a custom peripheral it seems to add it to both the DCache and ICache areas, which makes all instructions un-fetchable, and you don’t want this region cached anyway since the data would need to be invalidated constantly (which is slow).
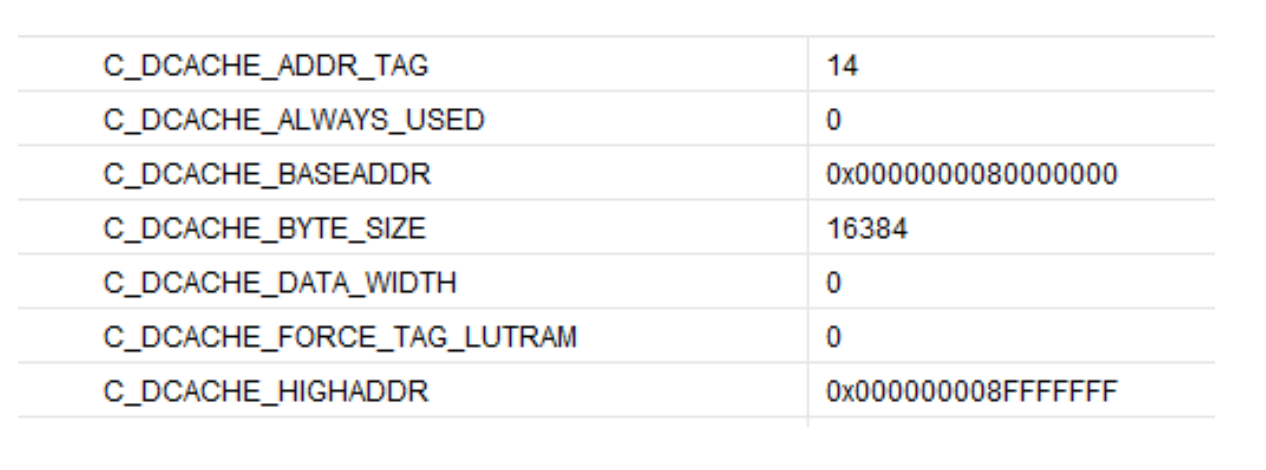
This shows the Data-Cache settings we are using:
This shows the Instruction-Cache settings we are using:
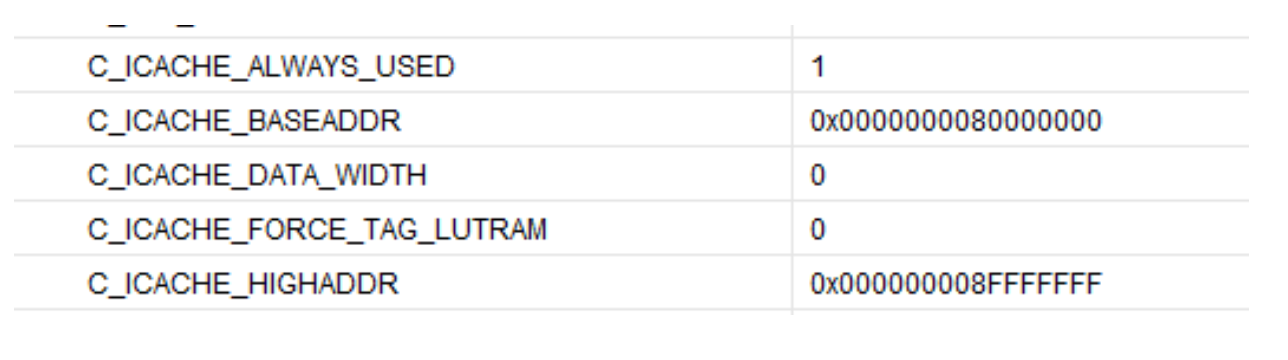
These settings are nothing special for a processor and make perfect sense if you are looking at a memory map, but Vivado gives you no obvious warning that your memory map may be the source of your issues when you can’t fetch instructions because your instruction cache is in the wrong location.
Hardware wrap-up
At this point, we can synthesize our specific hardware and move on to the glorious abstraction that is C. There are some things to note here for future implementations and work. This decision to use a Microblaze processor has a lot of baggage with it. The Microblaze processor has some timing requirements that are not so easy to just “increase” and we add a significant overhead to performance versus just implementing a hardware-only (no processor) interface between the backplane reader and the ethernet module, but this is also a lot of Verilog to do this (correctly) and was causing a lot of issues. By adopting the abstraction of the processor, the Microblaze system takes care of all of the requirements for handshakes, packet buffers, receiving, sending, and everything else, but we pay in performance. This is something that may be removed in the future if this moves on to become a real product with the ability to significantly reduce cost by not needing a processor. Either a single FPGA chip or an ASIC could be produced to perform the lifting of XBus to UDP. Alternatively, by adding a higher-speed processor, we could move the processing done externally for the proof of concept, to the onboard processor (say, if we had more threads), to reduce the overall footprint. It is important to keep in mind that most of the design decisions chosen here were for a working proof of concept, and may not be ideal moving forward to a real product.
Software Solution
Programming our new Processor
As we move into the land of C we need to keep in mind that we are programming a bare-metal processor (essentially working with a microcontroller).
The simplicity of main
We have the luxury of working with LWIP (IP stack) to do the heavy lifting with the networking, but not much else is provided, and we are the only task running. As such, we need to do some pretty generic setup.
ip_addr_t ipaddr, netmask, gw;
/* the mac address of the board. this should be unique per board */
unsigned char mac_ethernet_address[] =
{ 0xde, 0xad, 0xbe, 0xef, 0x13, 0x37 };
send_netif = &server_netif;
init_platform();
/* initialize IP addresses to be used */
IP4_ADDR(&ipaddr,  192, 168,   1, 10);
IP4_ADDR(&netmask, 255, 255, 255,  0);
IP4_ADDR(&gw,      192, 168,   1,  1);
lwip_init();
/* Add network interface to the netif_list, and set it as default */
if (!xemac_add(send_netif, &ipaddr, &netmask,
                    &gw, mac_ethernet_address,
                    PLATFORM_EMAC_BASEADDR)) {
    xil_printf("Error adding N/W interfacenr");
return -1; }
netif_set_default(send_netif);
/* specify that the network if is up */
netif_set_up(send_netif);
/* Set up our global PCB for UDP */
upcb = udp_new();
err_t err;
ip_addr_t remote_addr;
err = inet_aton("192.168.1.255", &remote_addr);
...
err = udp_bind(upcb, &ipaddr, 0);
...
err = udp_connect(upcb, &remote_addr, 13370);
...
Error handling has been trimmed for brevity, but this initialization simply sets up the LWIP stack, defines our MAC and IP addresses, and configures our interface for sending. It also configures where we are sending, which in this case is broadcast over the 192.168.1.X network. This was chosen for the simplicity of configuration during testing and could be changed to a unicast address later.
Once we do our initialization we move on to the import part of the main.
// EXPERIMENTAL: This size could possibly not be enough?
packet = pbuf_alloc(PBUF_TRANSPORT, 0x400, PBUF_RAM);
/* now enable interrupts */
platform_enable_interrupts();
/* receive and process packets */
while (1) {
}
This code is what allows our processor to hang forever processing interrupts, and what also gives us the ability to have zero-copy (at least before LWIP) sending of UDP packets giving us the performance to keep up with the backplane speed. We allocate a single packet buffer of a set size and reuse this buffer every single time we get a packet. This buffer is populated during an interrupt and sent at the same time. Once we enable the interrupts we leave the processor to wait and act on each interrupt and loop forever.
ma..Interrupted
The real magic in this XBus processing is using interrupts to preempt the Microblaze processor when an XBus message is ready to be sent. This is the only way we can guarantee that messages won’t be overwritten by the time the processor gets around to sending a message, that we aren’t sending duplicates of the same message, and we are trying to send a message while data is being written to the buffer.
During our platform_init() we are setting up interrupts for the processor during operation with a call to platform_setup_interrupts(). This function is responsible for initializing and starting the interrupt controller for the Microblaze processor, and we insert our platform_setup_backplane(intcp) into this initialization.
Within platform_setup_backplane(intcp) all we need to do is register our custom interrupt handler for the interrupt associated with our BackplaneReader_AXIL peripheral. The handler itself is quite simple:
void BackplaneInterruptHandler(void *CallbackRef) {
    // We need to get the size of the buffer so that we can set the pbuf size accurately, this reduces work
    // on the recv end.
    u32 size = BACKPLANEREADER_AXILITE_mReadReg(0x44a00000, 63*4) + 1;
    if (size == 0) {
        return;
}
    // We don't want to copy anything, just grab the memory directly where it is, this significantly reduces
    // time to send the packets.
    packet->payload = (void *) 0x44a00000;
    packet->tot_len = size * sizeof(int);
    packet->len = size * sizeof(int);
    err_t err = udp_send(upcb, packet);
    if (err != ERR_OK) {
        xil_printf("send error", err);
return; }
}
This handler needs to be designed to operate as quickly as possible since the Microblaze processor will preempt itself during an interrupt. This can lead to issues such as memory leaks, and lost data. Originally, this design included pbuf allocation and freeing, but was too slow to complete before the next interrupt came in. This caused a memory leak where the processor would no longer be responsive to new XBus messages that came in.
In this design, no memcpy or allocations are required. We reuse the global pbuf that is allocated in the main and just change the payload pointer as well as the tot_len and len fields. We can get these values by reading the last register within the memory-mapped region of our peripheral, due to our special register that holds the number of memory-mapped registers that are populated for any given message. This allows us the ability to not worry about zeroing registers and also gives us the ability to ignore extra data since we know the exact length.
Once we have the length, we can just populate the proper fields within the UDP pbuf and send the packet, LWIP handles everything else. This allows us to avoid copying the data as well as making execution extremely fast so we don’t preempt our code (at least any noticeable amount).
Software wrap-up
There are a few bugs with this approach currently. The largest of which is the truncation of data from the backplane. This only occurs when the message modulo 4 is not equal to zero. This was deemed out of scope for the proof of concept due to a huge portion of the messages being aligned on four-byte boundaries. Additionally, the eight-byte footer of all XBus messages is assumed to be a checksum of some sort, and as such, we will never truncate “important” data for processing currently. This would require an addition to the hardware implementation that would move the data to the proper offset of memory-mapped registers after zeroing out un-unrelated data within the register when you have anywhere from one to three bytes at the end of a message.
XBus backplane traffic analysis
Data bus exploration
The first solution to extract data was far from perfect. Using the Saleae, we captured the data on each of the important data pins. Once we captured the data, we exported this to a CSV. This CSV contained the transitions of each line and the time it transitioned. Using this information we could extract the number of bits at each transition and turn it into ASCII data (1 and 0) which we then converted to binary data. This gave us early access into what the data looked like and allowed us an easy way to search for bit patterns and troubleshoot some issues with our capturing of data during the process of finding a real solution. While this works well, it is not a reasonable approach for real-time monitoring or alerting, but it provided us an excellent way to check our work for complex solutions.
More sustainable sniffing
With XBus messages getting pulled off of the backplane and sent across the wire from an FPGA it is now necessary to take that traffic and find a way to get it into Snort. For this PoC (and time), we are extracting UMAS messages contained within XBus, however, future XBus analysis is possible, as all extraction happens post-FPGA. Once UMAS messages have been extracted, a TCP connection containing the traffic is spoofed on Snort’s inspection interface, allowing us to leverage all of the detection and alerting capabilities of Snort 3.
Receiving traffic from the FPGA
As the FPGA reads XBus messages off of the backplane it sends that traffic via UDP out over broadcast. These messages will then need to be parsed before we can do anything with them.
Handling high speeds
The FPGA is sending traffic at approximately 1,143 UDP datagrams per second. Unfortunately, this ends up being a bit too fast for Python to handle in a normal recv loop. To solve this we have used the multiprocessing plugin to spin up multiple recv loops and put the results into a shared queue. This seems to help up to about 10 workers, after which an efficiency increase is not noticeable.
Unfortunately, this does not completely fix the problem at high speeds, but it catches enough for a PoC. The remaining problems exist but could be solved with either a more complete hardware solution or a compiled message processor.
Parsing FPGA messages
Traffic coming from the FPGA can arrive in one of two states:
- One XBus message.
- A grouping of multiple related XBus messages.
Regardless of the state in which the UDP message arrives, the endianness of the message will need to be swapped. Due to restrictions in place from Microblaze, the message will be sent in four-byte little-endian blocks. To properly interpret the message these must be flipped, as shown below:
Raw UDP Message
------------------------------------------------------
0000   26 84 75 05 f9 05 27 04 00 15 08 36 06 59 0c 0a
0010   00 00 00 1b 00 01 64 08 d9 d9 7f 00 03 00 5a 06
0020   00 a2 11 03
```
```
Endianness-Fixed UDP Message
------------------------------------------------------
0000   05 75 84 26 04 27 05 f9 36 08 15 00 0a 0c 59 06
0010   1b 00 00 00 08 64 01 00 00 7f d9 d9 06 5a 00 03
0020 03 11 a2 00When UDP traffic from the FPGA arrives containing one single XBus message there is not any additional processing that must be done before moving on to UMAS extraction. In cases where a grouping of XBus messages is contained, they must be split apart before UMAS messages can be extracted from them.
Since we are only demonstrating UMAS via XBus traffic at this time, true analysis on how to split apart arbitrary XBus messages has not been performed. We have instead focused on how to split apart specifically the messages containing UMAS data.
Through analysis, it was determined that the flag b'x08x64x01x00x00x7f appears in the first (and only the first) XBus message of every UMAS message. Fortunately, this flag also does not appear to ever show up in any XBus messages that are not related to UMAS. Using this it is possible to continue processing only the messages containing this flag and discard the rest. Note that since related XBus messages will always come sent as a single UDP message this will not result in loss of the end half of the UMAS message.
An example of a message from the FPGA containing one XBus message that holds one UMAS message will have a payload similar to the following:
Endianness-Fixed UDP Payload
------------------------------------------------------
0000   05 75 84 26 04 27 05 f9 36 08 15 00 0a 0c 59 06
0010   1b 00 00 00 08 64 01 00 00 7f d9 d9 06 5a 00 03
0020   03 11 a2 00
We can extract the UMAS message by parsing this message type:
An example of a message from the FPGA containing multiple XBus messages that collectively one UMAS message will have a payload similar to the following:
Endianness-Fixed UDP Payload
------------------------------------------------------
0000        04 05 00 27 04 26 05 ea 98 08 43 00 0c 0a 70 06
0010        1b 00 00 40 08 64 01 00 00 7f d9 d9 06 5a 00 fe
0020        02 0d 00 00 a2 9b 02 00 00 02 04 7c 00 05 ef de
0030        04 05 08 27 04 26 04 f8 94 08 0d 00 00 a2 9b 02
0040        00 00 02 0e 00 0d 0a 03 e4 07 02 0e 08 0c 0a 03
0050        e4 07 02 00 00 00 08 50 72 6f c8 a4 00 17 bf 78
0060        04 55 90 27 04 26 05 bc 86 08 6a 65 63 74 00 43
This will split up into the following XBus messages:
Endianness-Fixed UDP Payload Split on XBus Messages
------------------------------------------------------

XBus Message 1
-------------------------------------------------------
0000        04 05 00 27 04 26 05 ea 98 08 43 00 0c 0a 70 06
0010        1b 00 00 40 08 64 01 00 00 7f d9 d9 06 5a 00 fe
0020        02 0d 00 00 a2 9b 02 00 00 02 04 7c 00 05 ef de

XBus Message 2
-------------------------------------------------------
0000        04 05 08 27 04 26 04 f8 94 08 0d 00 00 a2 9b 02
0010        00 00 02 0e 00 0d 0a 03 e4 07 02 0e 08 0c 0a 03
0020        e4 07 02 00 00 00 08 50 72 6f c8 a4 00 17 bf 78

XBus Message 3
-------------------------------------------------------
0000        04 55 90 27 04 26 05 bc 86 08 6a 65 63 74 00 43
In this case, XBus Message 1 will be parsed the same way as the single message. XBus Message 2 will use the entirety of the XBus Payload section to contain UMAS message data. XBus Message 3 will follow the same header as the previous two, however, it will only contain as many bytes as are remaining according to the XBus Payload Length field, followed by an untrusted-length footer.
Once in this state, the messages can be passed along for UMAS extraction.
Extracting UMAS from XBus
Once a grouping of XBus messages containing a single UMAS message has been isolated it is possible to extract the complete UMAS message. If there is only one XBus message, the UMAS message can be extracted from the UMAS Message field documented above. This becomes more complicated when dealing with multiple XBus messages.
Using the grouped example from above, we start with the following XBus messages.
Endianness-Fixed UDP Payload Split on XBus Messages
------------------------------------------------------

XBus Message 1
-------------------------------------------------------
0000        04 05 00 27 04 26 05 ea 98 08 43 00 0c 0a 70 06
0010        1b 00 00 40 08 64 01 00 00 7f d9 d9 06 5a 00 fe
0020        02 0d 00 00 a2 9b 02 00 00 02 04 7c 00 05 ef de

XBus Message 2
-------------------------------------------------------
0000        04 05 08 27 04 26 04 f8 94 08 0d 00 00 a2 9b 02
0010        00 00 02 0e 00 0d 0a 03 e4 07 02 0e 08 0c 0a 03
0020        e4 07 02 00 00 00 08 50 72 6f c8 a4 00 17 bf 78

XBus Message 3
-------------------------------------------------------
0000        04 55 90 27 04 26 05 bc 86 08 6a 65 63 74 00 43
These messages can then be broken apart into their known fields. Keep in mind that some of the documented fields do not show up in messages other than the first.
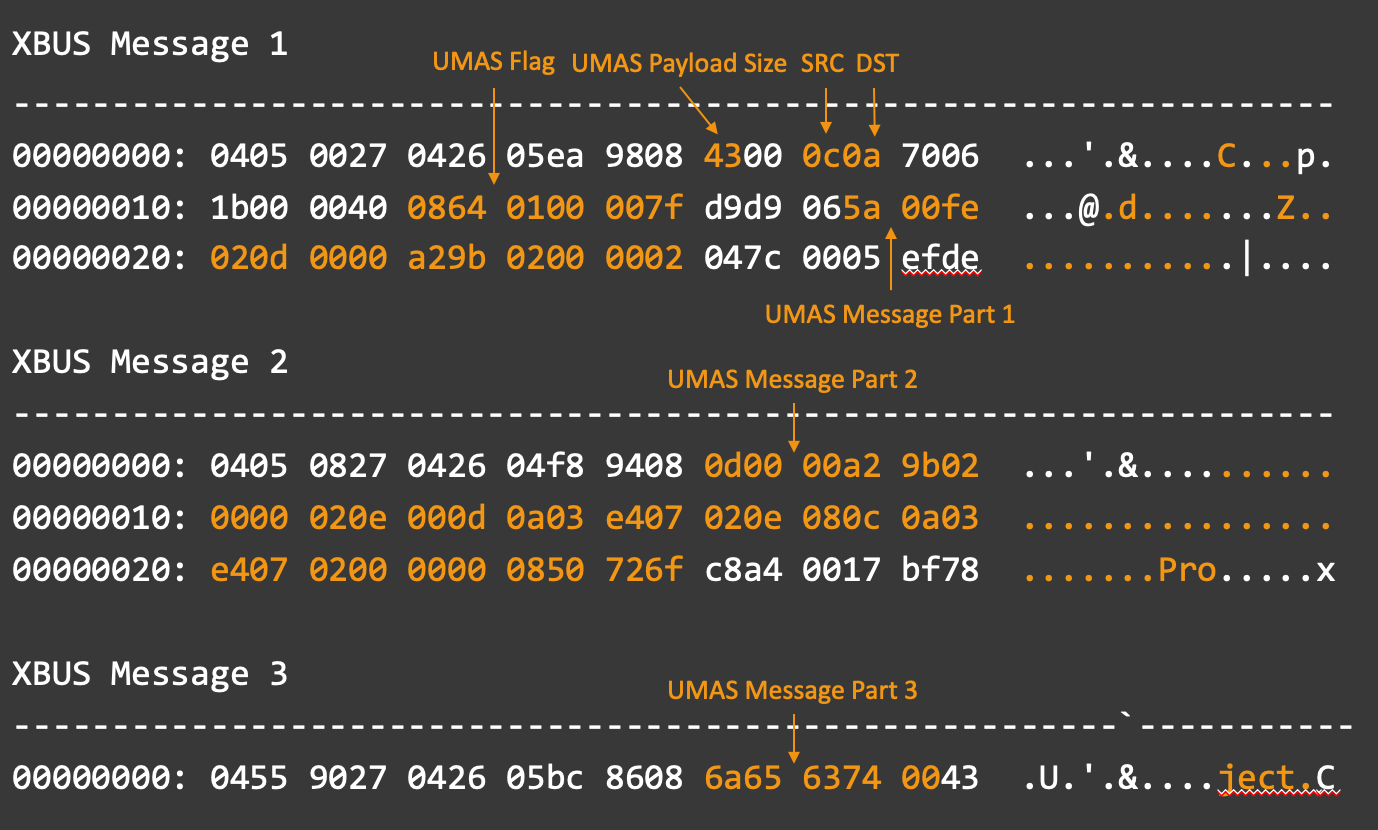
After visualizing the layout, it becomes easier to calculate the location of the desired UMAS message part using the following assumptions:
- The first XBus message will always contain the UMAS flag.
- The length field will always be at offset 0x0A in the first XBus message.
- The value in the length field will always contain the total size of the UMAS message, plus 0x12 bytes for non-umas XBus payload information in the first packet.
- The maximum size of any given UMAS-related XBus packet is 0x30 bytes with 0x20 reserved for the XBus payload.
- The footer field on the last XBus message cannot be trusted.
When properly extracted, we will be left with a UMAS message similar to the following:
00000000: 5a00 fe02 0d00 00a2 9b02 0000 020d 0000  Z...............
00000010: a29b 0200 0002 0e00 0d0a 03e4 0702 0e08  ................
00000020: 0c0a 03e4 0702 0000 0008 5072 6f6a 6563  ..........Project.
00000030: 7400
Spoofing a connection
With a properly formatted UMAS message now in hand, a method of getting that traffic into Snort is needed. Our quick solution to this was to create a TCP stream containing this traffic across an interface on which Snort was listening. Since we don’t need to send the message anywhere, we only need to make Snort think we did, we can use Scapy to craft the entire conversation.
Unfortunately, we do not have actual addresses for the source or destination, only single-byte identifiers. Since we would like to retain this information, we use that value as the last byte of a MAC address for the device (DE:AD:BE:EF:00:XX) and the last octet of an IP address (192.168.0.XXX).
By sending this traffic out over loopback while having Snort listen on the same interface it is possible to get Snort to process the traffic.
It should be noted that there are much better ways of getting Snort 3 to ingest this data, which should be used in a true implementation, however, the development of that functionality was out of the scope of this project.
Traffic detection in Snort 3
Since this connection results in standard Ethernet traffic, nothing special is required to get that information into Snort3, simply attach a snort sensor to the relevant interface, as discussed in the Snort3 documentation.
Caveat
The approach taken here to get Snort to ingest XBus traffic was chosen due to time constraints with the project. Much more efficient ways exist to get this type of traffic into Snort and properly decoded, however, the time involved in doing so was deemed out-of-scope.
Proof of Concept
0:00
Impact
The inability of security teams to properly monitor all traffic crossing the backplane is a problem in today’s OT networks. Proprietary protocols that were once obscured from view are now being brought to light and decoded with modern tooling. Since these protocols are often capable of making critical changes to the devices that they speak to, more focus is being put on them by malicious actors and legitimate operators alike. Without the ability to see everything going on on the backplane networks, operators are leaving their monitoring tools like Snort3 blind to potential attacks.
Security vendors can’t solve this problem on their own. While groups like Cisco are capable of building the hardware to perform this type of monitoring, the impact to customer warranties introduced by plugging in a third-party module cannot be ignored. For monitoring of this type to truly become an option, consumer demand must drive the conversation. PLC vendors have both the capability and the product expertise to create products that accomplish what Badgerboard set out to do; they just need to be pushed by their customers.
Resources
- Badgerboard S4x24 talk
- Coming Soon
- Badgerboard source code
- Weaselboard
- Snort 3 Usage
Go to Source
Author: Carl Hurd